Being Financially Disciplined is Difficult, if it is Learnt Earning Money is Very Easy!

Trade Recommendations: March

Click here to know About Us:

Technical Analysis Learning:

OUR TRADE RECOMMENDATIONS PERFORMANCE:

Click here to SubscribeOUR TRADE RECOMMENDATIONSas a PERSONALISED SMS.

Friday, 31 August 2012

Trading Ideas 31st August

2:20 IST Buy SBI 1845 Target 1900 Not triggered

1:38 IST Buy Sterlite 95.25 Target 98 2:53 IST Current price 95.75 follow with TSL 3:15 IST Exited at 97.5

11:40 IST Buy ONGC 276.3 SL 274 Target 279 Follow with TSL at cost current price 277.4 12:10 TSL hit at cost , Some exited at 278

11:15 IST Buy Chambal Fertilisers 65.3 SL 64 Target 66, 68 Follow with TSL at cost current price 65.75 1:00 IST 1st target achieved 2nd Target achieved on 3rd September

10:00 IST Buy Tata Global 131 SL 128 Target 134 Follow with TSL at cost current price 131.7 Hit TSL at cost

Thursday, 30 August 2012

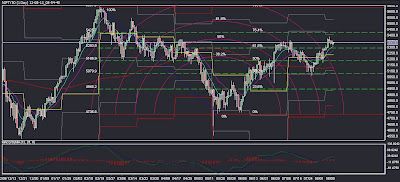
Nifty Intraday Technicals - 31st August

Support/Resistance levels indicated were respected on 30th August.

At the first look, Nifty seemed like closed above 200EMA and everything going to be positive. But when observed in details, it is learnt that there are warning signal in the form of, MAs not yet crossed +ve. Hence sustained break above 5310 is must for Nifty on 31st to be able resume its upward momentum.

Support Levels: 5295, 5270, 5250, 5190 (Sustained close below 5190 is Bearish for medium term)

Resistance Levels: 5323, 5350 and 5385 (Sustained close above 5385 is bullish for short term)


Trading Ideas 30th August

3:15 IST MTNL BTST buy @ 35 Target 40+

11:28 IST Buy Reliance 777 SL 774 Target 780, 784 11:33 IST 1st Target achieved 2:28 IST 2nd Target achieved

Nifty Intraday Analysis 30th August

After closing weak yesterday, Nifty will start its day with weak to flat global cues. As long as Nifty remain below 5295 intraday trend remain weak. A sustained break above 5295 will have initial target of 5323. On the down side targets are 5250 and 5230.

Support Levels: 5270, 5250 and 5230

Resistance Levels: 5295, 5323 and 5350


Wednesday, 29 August 2012

Nifty Technicals - Medium Term View

Due to options activity in the August series Nifty failed go above 5500 and took a U turn from around 5450 levels. Up on breaching 5383 significant Fibonacci level in Nifty's long term trend, it turned weak and quickly gave away 100 points.

Only on sustained close above 5385 Nifty will resume its up trend.

Support Levels: 5250, 5190 and 5000

Resistance Levels: 5305, 5350 and 5385.

Trading Ideas 29th August

11:30 IST Short MCdowel in Cash 981 Target 960 SL 993 Booked profit at 963

10:40 IST Buy Aurobindo Pharma 112.7 SL 111 Target 114.4 2:00 IST Exited at cost

9:45 IST Buy LT 1372 SL 1335 Target 1383, 1400 SL Moved to 1340 Open Expired at 1354 on 30th

Update inprogress..

Nifty Technicals 29th August

Seems to be another range bound day ahead.

Nifty Supports: 5305, 5280

Nifty Resistances: 5355, 5365, 5385

Sustained close above 5385 is must for Nifty to resume its up trend. Continuous failure here may result in bigger corrections.

Tuesday, 28 August 2012

Trading Ideas 28th August

1:00 IST Buy SBIN 1835 SL 1830 Target 1860 1:15 IST Current price 1842 follow with TSL at cost 3:00 PM Exited at 1858

1:00 IST Buy Axis bank 1015 SL 1012 Target 1027 1:15 IST Current price 1020 follow with TSL at cost TSL triggered at cost , those waited closed at 1022

Monday, 27 August 2012

Nifty Technicals 28th August

Nifty, after briefly coming below 5350, closed just above 5350. Indicating its uptrend is not over yet. How ever a sustained close above 5385 is required for Nifty to test higher levels, sustained failure near 5385 may result in bigger corrections on Nifty.

Considering Dowjones is trading near its previous highs and Nifty is trading around 16% below its November 2010 high, any support from global markets may result in Nifty testing its highs around 6300. At the same time failure of global markets at their highs may result in Nifty testing its deeper support levels around 4770.

Until clear trend emerges, traders shall consider each day at a time and take trading decisions accordingly. As far as intraday technicals is concerned for 28th August, below 5385 it is sell on rallies. Nifty resistances for today are placed at 5355, 5385, 5400 and 5420. Supports are placed at 5350, 5300. Final support for the current up trend is at 5180

Trading Ideas 27th August

3:10 IST Exited all positions

1:50 IST Buy Mcdowel in Cash/intraday 928 SL 923 Target 939, 947 1st Target achieved close. Nifty very volatile

1:45 IST Buy Hindalco 110.25 SL 109.3 Target 114 Exit 110.25

11:50 IST Buy DLF 205-.5 SL 203 Target 209 SL moved down 200 Exit 201.5

10:30 IST Buy Finantech 837 SL 830 Target 844, 847 Hit SL later came up to 840!

10:25 IST Buy Relaice 791 SL 784 Target 797 (Intraday) 810 2-3 days Exit 791

10:15 IST Buy JP Associates 74.6 SL 73.4 Target 75.4, 76 n 76.4 SL Triggered

Nifty Technicals 27th August

Nifty hovering around 5400 last week. Today it may open above 5400 but may face resistance at 5420 and 5450. August FnO series seems to end below 5500.

As long as Nifty stay above 5400 today we can expect 5420 to 5450 range. On the down side supports are place at 5370 and 5350. Sustained break below 5345 may invite bigger correction and sustained break above 5450 will confirm the rally towards 5500-600 range.

Saturday, 25 August 2012

Trading Ideas 24th August

Updated on 25th. Live calls were not posted:

Buy Mcdowels in intraday (Futures in ban) 920 Target 927, 934 Both Target achieved

Buy Century Textiles 318 Closed at 323.4

Buy DLF 209.5 Trailing Stop hit at cost

Buy HDIL 75.5 Closed at 76.3

Thursday, 23 August 2012

Trading Ideas 23rd August

3: 20 IST Positional Call for delivery, buy Mc Dowells @ 935 Target 1000

02:10 IST Buy IDFC 143.75 Target 145 Open

02:00 IST Buy HDIL 78.5 Target 79.7 Closed at 78 on 24th 

9:35 IST Buy Abirlanuvo 807 Target 814 Closed at 810

9:30 IST Buy HDIL 79.5 Target 82 9:55 IST Current price 80.7 Follow with TSL Closed at 80.5

Nifty Intraday - 23rd August

Nifty seems to be not in a mood to give-up recent gains! Inspite of global weakness, today Nifty managed to go higher though could not sustain at the top. Nifty managed to break previous day's high. On intraday basis, we must consider Nifty is in uptrend as long as it close above 5400. If Nifty manage to cross yesterday's high of 5432 next resistance may come at 5450-60 zone on intraday basis but the medium term target of Nifty is 5600 with Support/SL at 5180
Click on Image to enlarge

Wednesday, 22 August 2012

Trading Ideas for 22nd August

11:25 IST Buy Rcom 55.1 SL 54.1 Target 56 1:30 IST Trailing Stop hit a cost

11:25 IST Buy Century Textiles 320 SL 318 Target 324 Target achieved on 23rd

11:25 IST Buy HDIL 81.8 SL 81.3 Target 82.4, 82.9 12:30 IST Closed at 82.8

Morning Buy Apollo Tyres 95.5 SL 94.5 target 98 SL hit

Wipro Buy ar 353 SL 348 Target 357 Target achieved

Nifty Intraday

Nifty is expected to open around 5400, as long as it can remain above 5380 we can expect a pull-back to upside. A sustained break below 5380 may drag Nifty down even more to 5360-50. If Nifty manages to take support in 5400-5380 range upside targets of 5440, 5450 may be possible. Stock specific action with down ward bias on Nifty may be flavor of the day! Stocks to observe Apollo Tyres, Cipla, McDowel


Interesting Points in Nifty Journey

It is amazing to see the Nifty Journey over the last decade! Enlarge the image and see the surprises for yourself! The image is self explanatory!
Click on image to enlarge

Tuesday, 21 August 2012

Dowjones Technicals

After briefly crossing above its previous high of 13278 Dow fell back below it. As analysed earlier, Dow recorded a high of 13306 and fell back below its previous high. Now the breakout should be considered as fake break out and will have target of 13000, 12800.

How ever a sustained break above 13280 will have targets of 13400, 13500 and 13700.

In our earlier post we expected Dow to retrace from 13250-13300 area, Dow did high of 13306. Hence we are in short on Dow from 13300. The SL for this trade is placed just above today's high at 13310.
Click on image to enlarge

Trading Ideas 21st August

Yesterday Jain Irrigation Buy SMS was sent 74.8 Closed today at 75.4

9:20 IST Short Infy @ 2410 n 2430 target 2400, 2380 (2-3 days) 11:35 IST Closed at 2405

Update inprogress....

Nifty Technicals - 21st August

Though Nifty achieved our 1st target of 5423 on 17th, it could not sustain there but immediately fell back to 5350 and took support. Today Nifty may try testing 5400-5425 area again. A sustained failure here will have targets 5350, 5290 and final support at 5170.

Since the beginning of current series our view was Nifty may test 5400-5500, though we are cautious, still there is no considerable change in our view. We shall re-consider our view if Nifty breaks and closes below the low of 17th August ie below 5350. The major concern at this point is lack of momentum near/above 5400 Nifty level. Note: All levels mentioned are Nifty August Futures
Click on image to enlarge

Saturday, 18 August 2012

JSW Steel Chart

JSW Steel broke its raising trend line on friday. Now the hopes are on its Moving Average supports placed at 711, 691, 683 and 670. Buying is advisable only near MA supports with very strict Stop Loss. Short zone is 740 to 775 with SL above 790... Note: This is not a trade recommendation

Drawing Trend Lines


Uptrends and downtrends are hot topics among technical analysts and traders, because they ensure that the underlying market conditions are working in favor of a trader's position, rather than against it. Trendlines are easily recognizable lines that traders draw on charts to connect a series of prices together. The resulting line is then used to give the trader a good idea of the direction in which an investment's value might move. In this article, you'll discover how to use this tool. It won't be long before you're drawing them on your own charts to increase your chances of making a successful trade!

Trendline Basics

Understanding the direction of an underlying trend is one of the most basic ways to increase the probability of making a successful trade, because it ensures that the general market forces are working in your favor.

Downward sloping trendlines suggest that there is an excess amount of supply for the security, a sign that market participants have a higher willingness to sell an asset, than to buy it. As you can see in Figure 1, when a downward sloping trendline (black dotted line) is present, you should refrain from holding a long position; a gain on a move higher is unlikely, when the overall longer-term trend is heading downward. Conversely, an uptrend is a signal that the demand for the asset is greater than the supply, and is used to suggest that the price is likely to continue heading upward.
Figure 1

Trendlines can vary drastically, depending on the time frame used and the slope of the line. For example, some securities can show aspects of uptrend/downtrends for months, days or even a few minutes, while others can become range-bound and trade within a sideways trend.

Support and Resistance

Trendlines are a relatively simple tool that can be used to gauge the overall direction of a given asset, but, more importantly, they can also be used by traders to help predict areas of support and resistance. This means that trendlines are used to identify the levels on a chart beyond which the price of an asset will have a difficult time moving. This information can be very useful to traders looking for strategic entry levels or can even be used to effectively manage risk, by identifying areas to place stop-loss orders.

Technical traders pay particularly close attention to an asset when the price approaches a trendline, because these areas often play a major role in determining the short-term direction of the asset's price. As the price nears a major support/resistance level, there are two different scenarios that can occur: The price will bounce off the trendline and continue in the direction of the prior trend, or it will move through the trendline, which can then be used as a sign that the current trend is reversing or weakening.

Drawing Your Own Trendlines

As mentioned earlier, trendlines are simply lines that connect a series of prices to give the trader a better idea of where the price of a particular investment is headed. The problem comes with figuring out which prices are used to create the trendline. As you may know, the open, close, low and high prices are easily obtained for most stocks, but which of these prices should be used when creating a trendline?

There is no one, distinct answer to this question. Technical signals generated by the various technical patterns/indicators are very subjective and trendlines are no exception. It is entirely the trader's decision when it comes to choosing what points are used to create the line and no two traders will always agree to use the same points. Some traders will only connect closing prices while others may choose to use a mix of close, open and high prices. Regardless of the prices being connected, it is important to note that the more prices that touch the trendline the stronger and more influential the line is believed to be.
In general, upward sloping trendlines are used to connect prices that act as support, while the given asset is trending upward. This means that upward sloping trendlines are mainly drawn below the price and connect either a series of closes or period lows. Conversely, a downward sloping trendline is generally used to connect a series of closing prices or period highs, that act as resistance while the given asset is trending downward. This is similar to what is shown in the chart above.

We should note that it is possible to use two trendlines on the same chart. However, this method, known as a channel, goes beyond the scope of this article.

To illustrate the concept of drawing an ascending trendline, we have chosen to look at the trading action of AutoDesk Inc. (ADSK) between August 2004 and December 2005. As you can see in Figure 2, the trendline is drawn so that it connects the lows illustrated by the black arrows. Once a trendline is established, traders would expect to see the price of the asset to continue to climb until the price closes below the newly formed support.

Figure 2

As time goes on, we can see in Figure 3, that the price tested the support of the trendline again in August 2005. This is important because the more times the price touches the trendline, the more influential the line is said to be. The price action illustrated by the arrow on the far right, would be used by traders as confirmation that the trendline is valid. In this case, traders would look to enter a long position as close to the trendline as possible.

Figure 3

Once a technical trader has entered a position near the trendline, he or she would keep the position open until the price moved below the support of the trendline. Most traders will constantly adjust their stop-loss orders by moving them higher, as the trendline continues to slope upward. This method ensures that a trader can lock in as much of the gain as possible, without being taken out of the position too early. Keeping a stop-loss order below an influential trendline is a strategic way to ensure that the asset has adequate room to fluctuate, without getting whipsawed. In this case, using the ascending trendline as a guide of an expected move higher, would result in a very profitable trade, as you can see in Figure 4.
Figure 4
The Bottom Line

Trendlines are used commonly by traders who seek to ensure that the underlying trend of an asset is working in favor of their position. Trendlines can be used effectively by traders to gauge potential areas of support/resistance, which can help to determine the likelihood that the trend will continue. This strategic advantage is available to any trader willing to take the time to learn how to draw a basic trendline and incorporate it into his or her trading strategy. Although many traders will argue over what prices to use when creating the trendline, remember that all will agree that the strength of the trendline increases as more prices test the support/resistance.

Trade Broken Trendlines


Plotting trendlines onto a chart is one of the easiest ways for technical traders to get a quick idea of an asset's direction.

As you may know, trendlines come in a variety of different forms and they can greatly vary in length and significance. In this article, let us take a look at an 11-month trendline that was identified on the chart of NVR Inc. (NYSE: NVR) in June 2007, and see how it affected the short-term direction of the stock's price. 

What to See
A price move through an identified trendline is one of the most common signals of a trend reversal and, as you can see in Figure 1 below, this was exactly what happened on the chart of June 12 NVR chart. Note that the drop below the trendline would likely be the first signal of a reversal in the trend, but also that it was important to pay attention to the lower-than-average volume because it could signal a failed break. The low volume was a concern for technical traders because it was showing that the bears were not as interested in pushing the price sharply lower as most were expecting. Given the low volume and lack of volatility, we must wait that it would be a good idea to wait several days to confirm that the bulls wouldn't be able to send the stock price back above the trendline.
Figure 1

What happened?In the case of NVR, the price started to move lower and with this came technical confirmation that the breakdown was valid. The bulls tried to step back in by pushing the price toward the newly formed resistance level, but this attempt was met with a flood of sellers. The retest of the resistance, also known as a throwback, is a common occurrence in trading and the failed move higher is usually the final piece of confirmation needed by traders looking to profit from a pullback.

When the dust settled near the end of July, volatility remained high and volume was trading at higher-than-average levels. NVR shares were hovering around the $600 mark - falling from a mid-month high of $723.

The break below the trendline was a good indication of the impending downward momentum and proved to be a profitable strategy for those who knew what to look for. 

No Man's LandThe clear signal of a stock breaking through a trendline is the first step to making a highly profitable trade. However, the act of taking a profit is not quite as easy. A trader's job becomes substantially more difficult when a stock is trading midway between influential levels of support and resistance because, from a technical perspective, the stock could go either way. The questions in the trader's mind come quickly: "Should I take a profit when the downward momentum lets up?" and "Is this just a period of consolidation before the bears continue to hammer the stock lower?"

As you can see from the chart below, NVR did trend lower for the next couple of months, ending near $560. It is important to mention that the extra percentage gain from $600 to $550 comes at a substantially higher cost because the trader consciously ran the risk of giving up a healthy gain in the event that the stock was able to find some unexpected strength. Notice how in Figure 2 the stock was trading halfway between the March 2007 high and the May low from 2006. This can leave a trader uncertain about the future direction. In addition, the declining volume again suggested that traders were losing interest. If a trader does not have a defined target, it may be a wise decision to close some or all of the position at a junction like this and to look for a trade with a higher probability of success.
Figure 2

A Strategy for Managing Stop LossesThere is also a strategy that traders can consider when using trendlines as a basis for a trade. Previous swing highs/lows are a good indicator of potential areas that may influence the stock's momentum. These are levels where the price has reversed in the past and traders will often look for this situation to occur again. As you can see in Figure 3 below, there can often be many levels of support/resistance and one strategy would be to set a stop-loss order above the previous level of resistance (in the case of a short position) and trail the order behind the price as it breaks below the lower price levels. Keep in mind that traders will pay more attention to levels that have been tested several times (red lines) because of their historical influence.

Figure 3

In this example, traders with a higher level of risk aversion, or those with a long-term investment horizon, may instead prefer to trail a stop order above the resistance found two levels above the current price. This would allow the given security to have more room to fluctuate and is used to profit from prolonged downward moves. It is important to note that this version of the strategy will lead to larger losses if the stop price is reached, but can also lead to larger gains.

What We LearnedA drop below a trendline is often used by traders as a signal of a reversal in the current trend. The clear move below a trendline is often a good indicator for determining a strategic entry price. Sometimes it only takes the implementation of a simple risk-management strategy to protect the gains made from an uptake in momentum that accompanies a breakdown through a trendline.

Friday, 17 August 2012

Trading Ideas 17th August

2:40 IST Buy Mcdowel again at 926 Target 929 2:45 IST Target  achieved

2:00 IST Buy BFUTILITIE at 426 Target 429, 434 SL 417 Closed at 427 due to week-end

1:50 IST Buy Mcdowell 930 SL 917 Target 934, 939, 944 2:00 IST 1st target achieved Booked at 936

11:30 IST Buy JUBLFOOD 1155 SL 1140 Target 1174, 1184 12:20 IST advised low risk traders to exit at 1168 2:19 IST Achieved both the targets

9:16 IST Buy Lupin 568 Target 574 SL 565. 12:05 IST Target achieved

9:15 IST Buy Ultratech Cement 1725 Target 1747 (2-3 days)

Thursday, 16 August 2012

Dowjones Technical Analysis Review

Dowjones respected 50%, 62% and 80% Fibonacci resistance levels and offered correction opportunities for shorting and then long for re-entry at lower levels. But after crossing 80% level though reversal candles are forming, Dow continuing its upward momentum. If the current rally do not end in 13200-13300 zone it will have much higher targets. At the start of this week, it looked like Dow set for a correction but some good (?) economic news and QE3 hopes faded the hopes of a correction. Lack of momentum may offer some correction soon. Dow may correct upto 12950 or so. However a sustained cross above 13300 may trigger another sharp rally to shake out weak shorters and end the rally around 13500-13750. Any move in this zone is a very good short opportunity.
Click on Image to enlarge

About us:


Thanks for your interest in MASTER THE TRADE. We are group of 3 friends started our journey in Stock Markets from the time we were pursuing education.

We have identified fortune in Equity Trading in the year 2005, since then studied stock markets and tried understanding basics of market moves. And by the end of 2008 we could find some clues in market moves from options open interest and traded/delivery volumes. To strengthen it further, we have also studied Technical Analysis theories like Elliot waves, Fibonacci, Gann theory. With this knowledge, we have developed custom indicators which provide us trade opportunity signals on various time frames.

Now, we have chosen to pursue career in the business of providing Trading & Investment recommendations for those who cannot spare time for the market analysis but enthused and interested in building wealth from Trading/Investing in Stock Markets. We help serious people from this group with PERSONALISED recommendations and achieve their financial commitments and goals.

To start it simple, we have created MASTERTHETRADE blog and posting Trading Ideas on Indian and Global Stock markets along with investment ideas in Indian Stocks.

Our dream is to provide Professional and PERSONALISED financial advisory in various products ranging from Stocks to Real Estate by year 2015, to help individuals meet their financial commitments and wealth aspirations.
We choose to start with Stock Markets. Other services will follow, as we grow and earn the trust of enthused clients like you.

Trading Ideas 16th August

10:50 IST Buy Mc Dowell futures at 905 (price moved to 903 by the time sms sent) Target 910, 920 SL 885 10:56 IST Current price 908 follow with TSL 11:36 IST 1st Target achieved 12:09 IST Closed at 914 3:30 IST Achieved 2nd Target also, day's high was 929.7

Update inprogress...

Wednesday, 15 August 2012

Independence Day Special - Trading the Trend


In Stock/Commodity/Forex the moves on Intraday, short-term, medium-term dependant on long term trend. Trading in intraday, short-term, medium-term time frames in the direction of long term trend results in consistent profits. For this purpose, we have identified the following setup with Moving Averages.
Here in this set up, we will first follow 2 years (2Y) chart, where 1 days = 1 tick/ 1 candle) of Nifty and plot 50, 100 and 200 EMA lines on the charts. Click here to see the chart
Now, on the chart click on Technical Indicators, select Exponential Moving Averages and enter values 50, 100 and 200 (10, 20 and 50 for short term and 20, 50 and 100 for medium term) as shown in the following picture
This will add 3 lines on the chart for 50 day EMA, 100 day EMA and 200 day EMA on the chart.
Click on Image to enlarge

Once the EMA lines are added, repeat the steps and add MACD also. After both EMA and MACD added chart will look as follows
Click on Image to enlarge
Click here to go directly to link that is already pre-configured with this set up
Once the set-up is done, note the EMAs values on the top right corner of the chart.
Rules for Long Term Trend Trading Game:
1.    In the long term (2Y Chart) note 50, 100 and 200 EMAs. If the values are 50EMA>100EMA>200EMA the long term trend is up and vice versa for down trend ie 50<100<200 EMAs
2.    In the above scenario (if 50>100>200 EMAs) we should always look for long opportunities in the intraday, shorter or medium term trading. And vice versa for short opportunities.
3.    If the price is too far (ie over 5% from the nearest EMA) there are two possibilities to be noted
a)    Wait for the Price to re-trace towards EMA and enter trades in the direction of Moving Average Cross Over.
b)    Look at MACD for divergence and take counter trend trades with targets at EMA lines.
4.    If trading with MACD cross over/divergence there are 2 types of trading opportunities can be identified
a)    Enter first position on MACD cross over (Long positions if cross over is far below “0” and vice versa for short) and enter the second position on the MACD lines crossing “0” line (Long if crossing from below to above and vice versa)
b)    Do not take position at first cross but wait for the MACD lines to cross “0” line to take position in the direction of cross over.
5.    The trend following long trades occur when 50>100>200 and the price touches these EMA lines with SL placed at next EMA line.
6.    Continuous close above farthest line from the current price is required for the trend reversal.
Example:
Click on Image to enlarge
In the above example, since April 2012 the trend has been down for Nifty and arrows marked in green on MACD are counter trend long opportunities and arrows marked in red are trend following short opportunities. Circles marked in black are EMA –ve cross over shorting opportunities. Circles marked in Green are long trading opportunities in +ve trend and circles marked in red are short opportunities in down trend.

Rules for Trading intraday, short or medium term based on long term trend:
1.    Identify the Long Term Trend on 2Y chart and move down to 5D chart where 1 tick/candle = 5 minutes.
2.    From the above example we knew that the trend has turned to +ve on 31st July 2012 when the Nifty Price closed at 5230 (Last green circle on the right side of the chart), so we should practically look for only Long Opportunities from the start of August month!
3.    After identifying trend on long term chart ie Long as of now, we shall move to 5D chart by clicking 5D at the bottom of the chart. Note: The EMA lines drawn on 2Y chart will remain of 5D chart also (5D = 5 days price chart)

Example of Trades:
Click on Image to enlarge 
In the above chart circles & arrows drawn in green are trend following Long Opportunities and Circle and arrows drawn are counter trend short opportunities in Intraday.
Note: It is always advisable to avoid counter trend trades in Intraday & short term as Stop Loss hit on these trades will be more than the profit potential. Hence, as far as possible it is better to stick to major trend and trade accordingly in Nifty. If Nifty’s trend is clear even most stocks’ trends will also be the same. Stick to rules and profits will follow…. Team MTT

Tuesday, 14 August 2012

Trading Ideas 14th August

1:11 IST IST SMS sent to Short Infosys at 2335 SL 2355 Target 2315 3:26 IST Exited at 2336 to avoid gapup move if any.

10:55 IST Short JP Associates 76.4 SL 76.7 Target 76, 75.8 11:04 IST Current price 76.15 Follow with TSL at cost 11:08 1st Target hit, book profit

10:15 IST Sent SMS at 9:30 IST to short ICICI at 968 with target at 956 and SL at 978 only few could short near 967.5 as the price did not hit 968, high was only 967.7 11:11 IST Current price 960 Follow with Trailing Stop at 963 11:30 IST Target achieved

Update in progress:

Nifty Technicals 14th August

* Levels mentioned are Nifty August Futures. Note: Today's Inflation Data may cause volatility in market.

There is nothing really happening to change our bullish view with target 5425, except the circled reversal candle with high at 5395. Until Nifty (August Futures) cross and sustain above this though the risk of down side prevails. But candle  formation after the circled candle suggesting come back of Nifty. However a sustained cross above 5395 is must for Nifty's bullish trend continuation. Supports: 5330, 5295, 5240 Resistances: 5395, 5425. For long term trend observers, as long as Nifty stay above 5050, 5600 target is a possibility. Continue holding your investments while booking partial profits in specific stocks and re-enter at lower levels.
Click on Image to enlarge

Monday, 13 August 2012

Trading Ideas 13th August

1:25 IST SMS sent to buy Tata Steel at 395.5 SL 394 Target 398 1:48 IST SL hit Later hit target also!!!! Low was 393.7!!

12:14 IST SMS sent at 12:05 to buy Hindalco at 120.7 Target 122, 123 SL 119 Current price 121.4 TSL hit at 121.2

9:52 IST Buy SBI at 1870 SL 1840 Target 1890, 1920 10:28 IST 1st Target achieved 12:08 Current price 1905 2nd Target achieved

9:20 IST Buy Rcom 54.8 SL 54.2 Target 55.3 Achieved in no time, but not sure how many could follow and enter the trade!

Nifty Technicals 13th August

We have been bullish on Nifty with first target at 5400 and on sustain break above 5425 the second target at 5500. As long as Nifty holds 5259-5300 range the current move is considered as consolidation with above targets. Any sustained break below 5240 will invalidate bullish view with targets at 5180, 5080. (Levels mentioned are based on Nifty August Futures Price)
Click on Image to enlarge

Friday, 10 August 2012

Dow Technicals Review

After being bullish, Dow has finally formed a -ve candle on Daily charts. Though this candle is not strong enough to reverse the trend, will have some impact on upside if not broken immediately. Support placed at 13000-12970 zone, a break below this will turn the trend -ve with 12950, 12850, 12700 targets.
Click on image to enlarge

Trade Recommendations - 10th August

1:25 IST Buy Axis Bank @ 1058 SL 1040 Target 1063, 1067+ Hit 2nd Target in minutes!!!!

10:18 IST Tata Steel Buy at 405-406 Target 409, 412 Trailing Stop hit at 406-405

9:20 IST HDIL Sell at 82.3 Target 81.5 Again buy at 81.5 Target 82, 82.45, 83 achieved. Bought again at 81.35

9:16 IST SBI Buy at 1955  Target 1985, 2000, 2020 achieved with in 10min. re-entered @ 1970 and following with 1970 SL. TSL hit at 1980. 12:47 Re entered at 1910

Thursday, 9 August 2012

Dowjones Technicals - 9th August

Though Dow intra-day charts chowing some weakness, daily charts are still firm and indicating some more up side if consolidated above 13000. Immediate Dwo resistance zone is 13200-300, if sustained above it may target new high. Supports are now placed at 13050, 12975. If 12950 breaks then it may become weak to test deaper supports like 12800, 12600. MACD, MAs supporting Dow up move, though momentum is weaken. For now everything looking 'all is well' for Dow, but deeper corrections happen when everything look good and everyone is bullish...let us see what will it do in coming days
Click on image to enlarge

Trading Ideas - 9th August

2:34 IST SMS alert sent @ 2:20 IST to buy SBI again at 1979 SL 1960 Targets 1990, 2000 (Today or tomorrow)

1:12 IST SMS alert sent @ 1:09 to buy HDIL @ 82 target 82.4, 83 1:17 IST HDIL hit both the target with in 10 minutes!

12:06 IST SMS Alert sent to buy SBI @ 2020 SL 2010 targets 2030, 2047 hit 1st target

10:52 IST SMS Alert sent @ 10:0 IST to buy Tata Steel @405-405.5 SL 403 Target 409, 412 11:00 IST Closed @ 407 Hit 2nd Target

Nifty Technicals 9th August

After achieved 5400 (5393 August futures high) as analysed by us on 6th August. Nifty formed a reversal candle on daily charts. Now Nifty's bias may turn -ve as long as Nifty August futures remain below 5395. A sustain break above 5395 will have initial target of 5423. Down side cross of 5315 will have initial target 5280 and 5250. Now Nifty forming a channel with 5250 support and resistances above 5500
Click on image to enlarge

Wednesday, 8 August 2012

Trading Ideas - 8th August

Sorry friends, could not post any trades here today. Our subscribers earned profits in HDIL, JP, Rcom and Tata Steel Shorts and Tata Motors, Hindalco & Reliance longs...I promise you, I will come out with some recommendations here tomorrow. Thanks for your support.

2:42 IST While market is going up and up, Rcom short opportunity identified at 11:40 AM is going down considerably making our subscribers richer!

12:57 IST

Tata Stee dropped from 415.3 to 412, JP dropped from 78.65 to 77.3, Rcom dropped from 58.1 to 57.1

Hindalco up from 122 to 123.2, Reliance up from 793 to 795 (1:35 IST 800+) Tata Motors up from 242 to 244+ (1:35 IST 245+)

After the post @ 11:37 IST. Judgement and timely decision making can earn more money in trading. Opportunities are unlimited, choosing the best one matters the most!


12:28 IST HDIL Short iis earning over 10k per lot traded!

11:37 IST Short opportunities in JP, Rcom, TCS and Tata Steel.

Long opportunities in Hindalco, LT, Reliance, Tata Motors

Which one to pick....?

Update In progress...


Busy with subscribed friends...will come here shortly...

Tuesday, 7 August 2012

Trading Ideas for 7th August

03:13 IST Short Tata Motors now at 239.5 SL 246 Target 238, 236, 235, 233 Carry pos 8th Aug, 9:16 IST Closed pos at 937

01:23 IST Short Reliance futures now at 797.7 SL 807 Target 795, 790, 780 1:36 IST 1st Target achieved 02:55 2nd Target achieved 03:10 IST Close Reliance now at 785

12:20 IST Short Rcom futures now at 59.3 SL 62 Target 58.8, 58.3 12:38 IST 1st target achieved 03:01 IST 2nd Target achieved Close now at 58

10:13 IST Short JP Associates now at 77.4 SL 81 Target 76, 75, 73 Carry pos 8th Aug 10:20 IST close pos at 77.25

10:01 IST Short Axis Bank Futures now at 1096.7 Target 1090, 1080 SL 1111 12:37 IST 1st target achieved

10:00 IST Short Tata Motors Futures now at 236.4 Target 235, 233 Carry pos 9th August follow with 236 TSL current price 235.5 9th August 2:30 both targets achieved!

09:55 IST Short TCS Futures now at 1247 SL 1257 Target 1237 1:37 IST SL Hit

09:55 IST Short SBI futures now at 2049 SL 2067 Target 2037, 2027 12:36 IST Close SBI now @ 2048

Update in progress.....

Monday, 6 August 2012

Rs. 15 Lacs + Wealth with Rs. 5,000 monthly SiP


If we split big targets into small targets and combine them all at the end, the big target can be achieved so easily! 

Example: With a Systematic Investment of Rs. 5,ooo per Month at a Monthly return of just 10%, in 3 years, our investment of Rs. 1.8 Lacs will become Rs. 16 Lacs plus. With out any greed if we slowly trade earning a consistent 10% monthly return on investment may not be very difficult task.

Month  Investment  Return  Montly Return   Cumulative 
01-08-2012           5,000.00 10%            500.00            5,500.00
01-09-2012           5,000.00 10%        1,050.00          11,550.00
01-10-2012           5,000.00 10%        1,655.00          18,205.00
01-11-2012           5,000.00 10%        2,320.50          25,525.50
01-12-2012           5,000.00 10%        3,052.55          33,578.05
01-01-2013           5,000.00 10%        3,857.81          42,435.86
01-02-2013           5,000.00 10%        4,743.59          52,179.44
01-03-2013           5,000.00 10%        5,717.94          62,897.38
01-04-2013           5,000.00 10%        6,789.74          74,687.12
01-05-2013           5,000.00 10%        7,968.71          87,655.84
01-06-2013           5,000.00 10%        9,265.58        101,921.42
01-07-2013           5,000.00 10%      10,692.14        117,613.56
01-08-2013           5,000.00 10%      12,261.36        134,874.92
01-09-2013           5,000.00 10%      13,987.49        153,862.41
01-10-2013           5,000.00 10%      15,886.24        174,748.65
01-11-2013           5,000.00 10%      17,974.86        197,723.51
01-12-2013           5,000.00 10%      20,272.35        222,995.87
01-01-2014           5,000.00 10%      22,799.59        250,795.45
01-02-2014           5,000.00 10%      25,579.55        281,375.00
01-03-2014           5,000.00 10%      28,637.50        315,012.50
01-04-2014           5,000.00 10%      32,001.25        352,013.75
01-05-2014           5,000.00 10%      35,701.37        392,715.12
01-06-2014           5,000.00 10%      39,771.51        437,486.63
01-07-2014           5,000.00 10%      44,248.66        486,735.30
01-08-2014           5,000.00 10%      49,173.53        540,908.83
01-09-2014           5,000.00 10%      54,590.88        600,499.71
01-10-2014           5,000.00 10%      60,549.97        666,049.68
01-11-2014           5,000.00 10%      67,104.97        738,154.65
01-12-2014           5,000.00 10%      74,315.46        817,470.11
01-01-2015           5,000.00 10%      82,247.01        904,717.12
01-02-2015           5,000.00 10%      90,971.71    1,000,688.84
01-03-2015           5,000.00 10%    100,568.88    1,106,257.72
01-04-2015           5,000.00 10%    111,125.77    1,222,383.49
01-05-2015           5,000.00 10%    122,738.35    1,350,121.84
01-06-2015           5,000.00 10%    135,512.18    1,490,634.03
01-07-2015           5,000.00 10%    149,563.40    1,645,197.43

Trade Recommendations - 6th August

02:02 Short Reliance now at 787.3 SL 797 Target 785, 782, 777 2:20 IST Current Price 785.5 Hold with TSL TSL at cost hit again

Short call via SMS on Infy is in 20+pts profit

12:30 IST Short Axis Bank now at 1077 SL 1097 Target 1070, 1060 12:35 IST First Target achieved

12:15 IST Short Reliance now at 784 SL 794 Target 777, 770, 760 12:37 IST Close now at 780

12:12 IST Short Hindalco now at 119.7 SL 122 target 119, 118, 116 12:38 1st Target achieved 01:36 IST 2nd Target achieved

10:50 IST Short HDIL at 84.95 SL 87 Target 84, 83 12:37 1st Target achieved. 03:09 2nd Target also achieved!

10:28 IST Short Reliance now at 781 Target 777, 775, 770 Current price 779 follow with Trailing Stop at cost

10:24 IST Short Rcom now at 58.1 SL 61 Target 57, 55 01:30 IST Book profit in Rcom now at 57.5

10:23 IST Short JP Associates now at 76 SL 77.8 Target 75, 74.8 01:35 IST Book profit now at 75.7


09:15 IST SMS sent on SBI Short going good, protect profits with Trailing Stop 12:35 IST closed with 20pts profit
Update in progress...

Nifty Technicals - 6th August 2012

After US and Europian markets closed higher on Friday, general expectation is that Nifty will also open gap-up. This gap-up open and any move upwards from there will face resistances at 5295, 5333 and 5420. While positive moving average and MACD cross-overs indicating higher moves on Nifty, mass sentiment is low with Nifty targets at 5050 & 4900. Any sustained break above 5300 will ruin the mass sentiment and make them run for short covering and this may result Nifty targeting 5400-5500 range quickly. So, today's gap-up open will have sustaining power or not will decide the future course of Nifty. Our expectation is that Nifty may steadily target 5420 with support at 5150, but mass market sentiment is not in our favor! Let us wait and watch for the direction...
Click on image to enlarge

Friday, 3 August 2012

Trading Ideas for 3rd August

12:50 Trail with appropriate SL now...do not lose already earned profits.Nifty Futures resistance at 5210

12:15 IST Buy Hindalco @ 116 Target 118, 120 SL 113 01:55 IST 1st Target achieved

11:53 IST Buy IDFC @ 130 target 132, 134 SL 126 Did not trigger

10:02 IST Buy L&T Now at 1357 SL 1343 Target 1367, 1377 (1-2 weeks 1400) Move SL 1337 02:50 1st Target achived 03:00 IST Book profit now at 1372 3:20 IST 2nd & 3rd Targets also achieved

9:47 IST Short TCS now at 1229 SL 1243 Target 1211, 1200, 1190 10:20 IST Current Price 1222 Use TSL to protect profit, TSL hit at 1227

9:44 IST Buy Tata Motors now at 218.9 SL 216 Target 222, 224. 02:28 IST 1st Target achived 03:00 IST CLose at 223.4

9:28 IST buy Axis Bank now at 1044 SL 1020 Target 1054 3:00 IST Book profit now at 1050

9:24 IST Buy HDIL now at 80.60 SL 78 Target 81.4, 82.4, 83.4 1:35 First Target achieved, Current price 81.5 1:55 IST 2nd Target achieved, Current price 82.6

Nifty Technicals - 3rd August

After repeated attempts to cross its resistance of 5240, Nifty formed a reversal candle yesterday. Now Nifty downward targets are placed at 5200, 5170, 5120 and 5060. Any fall towards 5120/5060 will be buying opportunity with SL at 5040. But sustained break of 5040 will invalidate this view with a down side target of 4900. Any recovery from 5200/5170 will have initial target of 5270, 5300 and 5350. So, while taking trade at any of the above said levels, momentum should be analysed at the mentioned level. Note: Levels mentioned are of Nifty Futures
Click on image to enlarge

Dax Technicals - 3rd August

All stock markets in recent past offering very good trading opportunities by moving with in a range. While US and Europian markets are moving with in an upward channel, NIFY is moving with in sideways range of 50-100 points. As predicted in our previous post Dax fell to its support to near 6550. A break below 6550 will have target of 6430 on Dax but other +ve indicators may limit its fall to near 6400. Any indications of taking support near 6400 or at current level of 6600 will be very good buying opportunity for targets 6550, 6700 and 6890. However a sustained break below 6400 will have downward target of 6220, 6150.
Click on image to enlarge.